This often used quote has been bugging me for a while: “In the 2011 New Zealand general election, 42% of eligible youth voters were non-voters”. A youth voter is anyone in the 18-24 age group. This elusive 42% is taken from the Non-Voters in 2008 and 2011 General Elections report, on page 9. The data came from the 2012 New Zealand General Social Survey. Whilst on the whole, the survey is representative and generally robust, Statistics NZ notes that the results may be inaccurate:
- Collection of self-reporting voting behaviour (i.e., survey participants get no help in filling out the survey).
- Voting population is people aged 18 years and over in the election year who provided valid responses to the survey questions. The voting population also includes people who were ineligible to vote due to visa status.
- A sample size of 8,500 people 15 years and older was used. Personal weights from the survey are used for population estimation (The sampled population may be skewed).
From these points, we must be aware that:
- Incorrectly filled surveys may have been excluded from the final results.
- The 18-24 age group has a higher proportion of international students and workers, who are unlikely to be eligible voters.
- The sample of 8,500 people is much less than the voting population of 3.27 million.
- We do not know if the 18-24 age group was over- or under-represented in the survey. An under-representation may lead to a higher margin of error.
The 2011 survey results, being 3 years old now, means that only a proportion of the 2011 non-voters are still youth voters. In addition, there is no disaggregated data on the non-voters, so the survey is not a true representation of the problem at hand. That is, the data is only available in aggregate form and we cannot distinguish between 18 year old voters from 24 year old voters. The survey is simply a measure or a way to take the pulse of the problem so to speak, a form of determining diagnosis.
Available Data on Voter Turnout
First, let’s look at the proportion of non-voters within each age group as given in the Non-Voters in 2008 and 2011 General Elections report. We can see the elusive 42% for the youth age group.
| Age Group | Proportion within the Age Group |
| 18–24 | 41.8% |
| 25–44 | 26.2% |
| 45–64 | 13.3% |
| 65+ | 5.2% |
This statistic was derived from the 2012 New Zealand General Social Survey. Below is a break down of the 2011 election voters, non-voters, and ineligible voters given in that survey. Unfortunately, there is insufficient commentary in the raw data to determine if ineligible voters only refers to people who were too young to vote. I say this because we would expect some ineligible voters in the 20-29 age group to be from international students and workers.
| Voter | Non-Voter | Ineligible | Total | |
| 15-19 | 39,000 | 85,000 | 170,000 | 294,000 |
| 20-29 | 367,000 | 245,000 | .. | 613,000 |
| 30-44 | 667,000 | 189,000 | .. | 856,000 |
| 45-64 | 959,000 | 145,000 | .. | 1,104,000 |
| 65+ | 546,000 | 30,000 | .. | 576,000 |
| All ages | 2,579,000 | 694,000 | 170,000 | 3,443,000 |
Curiously, the age groups in the raw data do not match up with the age groups given in the report. Let’s assume that the 124,000 eligible voters in the 15-19 age group were in fact 18-19 year olds. We can see that 68.5% of the 18-19 age group were non-voters and 40.0% of the 20-29 age group were non-voters. Collectively, there were 330,000 non-voters in the 18-29 age group (i.e., 44.8% of the age group). Unfortunately, there is not enough information to draw any conclusions about the proportion of youth (18-24 age group) who were non-voters.
The New Zealand Electoral Commission also conducted its own survey, Voter and Non-Voter Satisfaction Survey 2011, but with a (smaller) sample size of 1,369 eligible voters. A breakdown of the sample for the 18-25 age band is given in Appendix B of the report and shows that 158 of the 425 people in that age band were non-voters (i.e., 37% were non-voters). Note that the survey used a booster survey for the 18-25 age band to gather more accurate information.
The Parliamentary Library Research Paper on the 2011 general election provides some more details on voter enrolment and turnout. However, no statistics on non-voters is given.
- 3.27 million people were eligible to vote.
- 3.07 million people were enrolled to vote (0.2 million people were not enrolled).
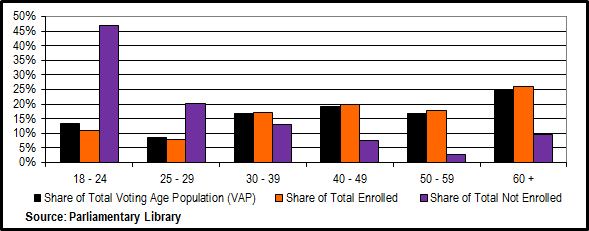
- 138,108 eligible voters were not enrolled and were under the age of 30 (Comparable to the 147,544 votes received by the New Zealand First Party).
L, our resident political commentator has the following thoughts:
For all I know they could be asking the wrong people the right thing. If it was like, okay we did some research, we found out that actually x number of 18 year olds and y number 20-24 year olds did not vote in these areas – we will put together a representative sample and ask them why. But even then it would be dubious. Better if they had done historical analysis or even a longitudinal study on the age data; what is the long term trend? Also is it mostly 18 year olds or 24 year olds? What? What if it is the proportion of young people not in education employment or training?